Hello
Hello, I'm Noah. Here's where you'll find a collection of programming projects I've been working on, photos I've taken, and other neat stuff, so have a look around.
Hello, I'm Noah. Here's where you'll find a collection of programming projects I've been working on, photos I've taken, and other neat stuff, so have a look around.
A data pipeline and machine learning model to evaluate the true value of publicly-traded stocks
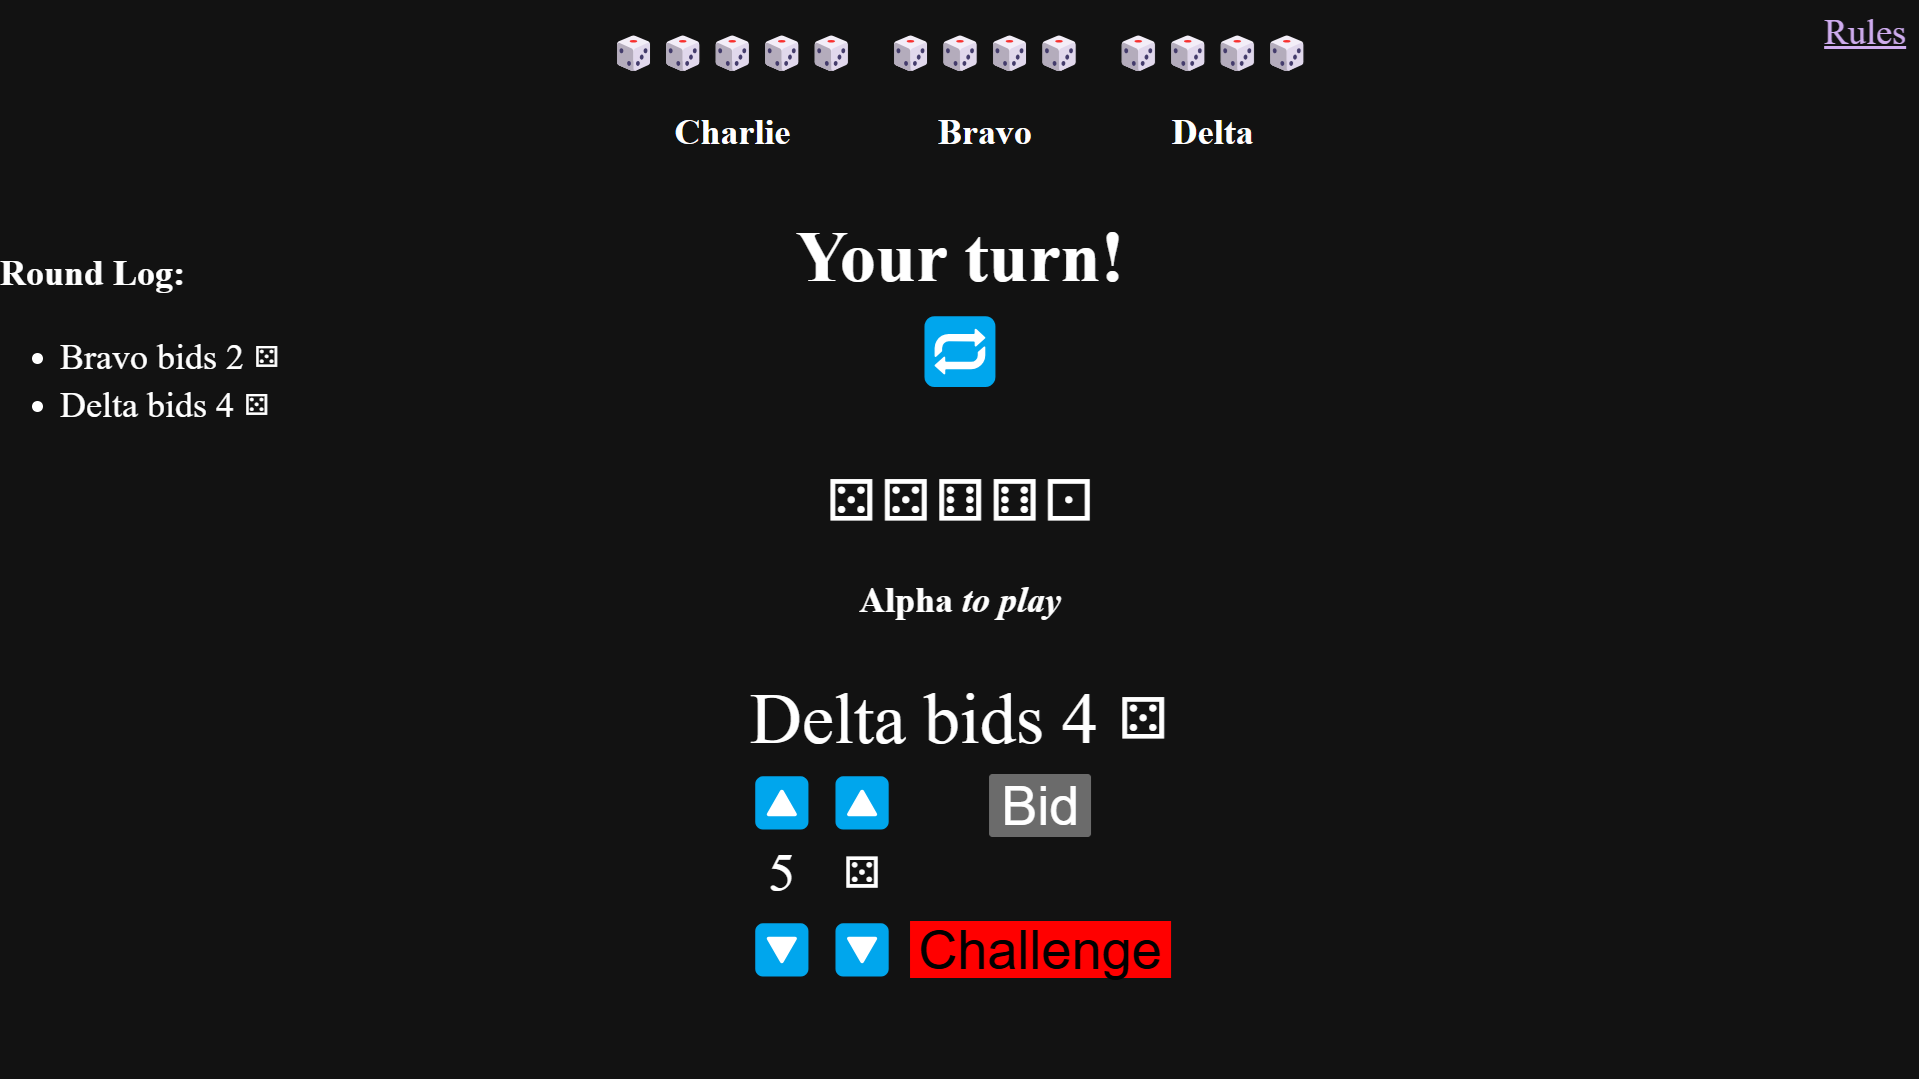
Liar's Dice is a fully online, web-based version of the dice game of the same name. It is written entirely in JavaScript; The frontend uses React, the backend uses Express, and socket-level communication is handled by Socket.IO.
The game was formerly hosted using Glitch. Due to the shutdown of Glitch's web hosting services, it is currently offline.
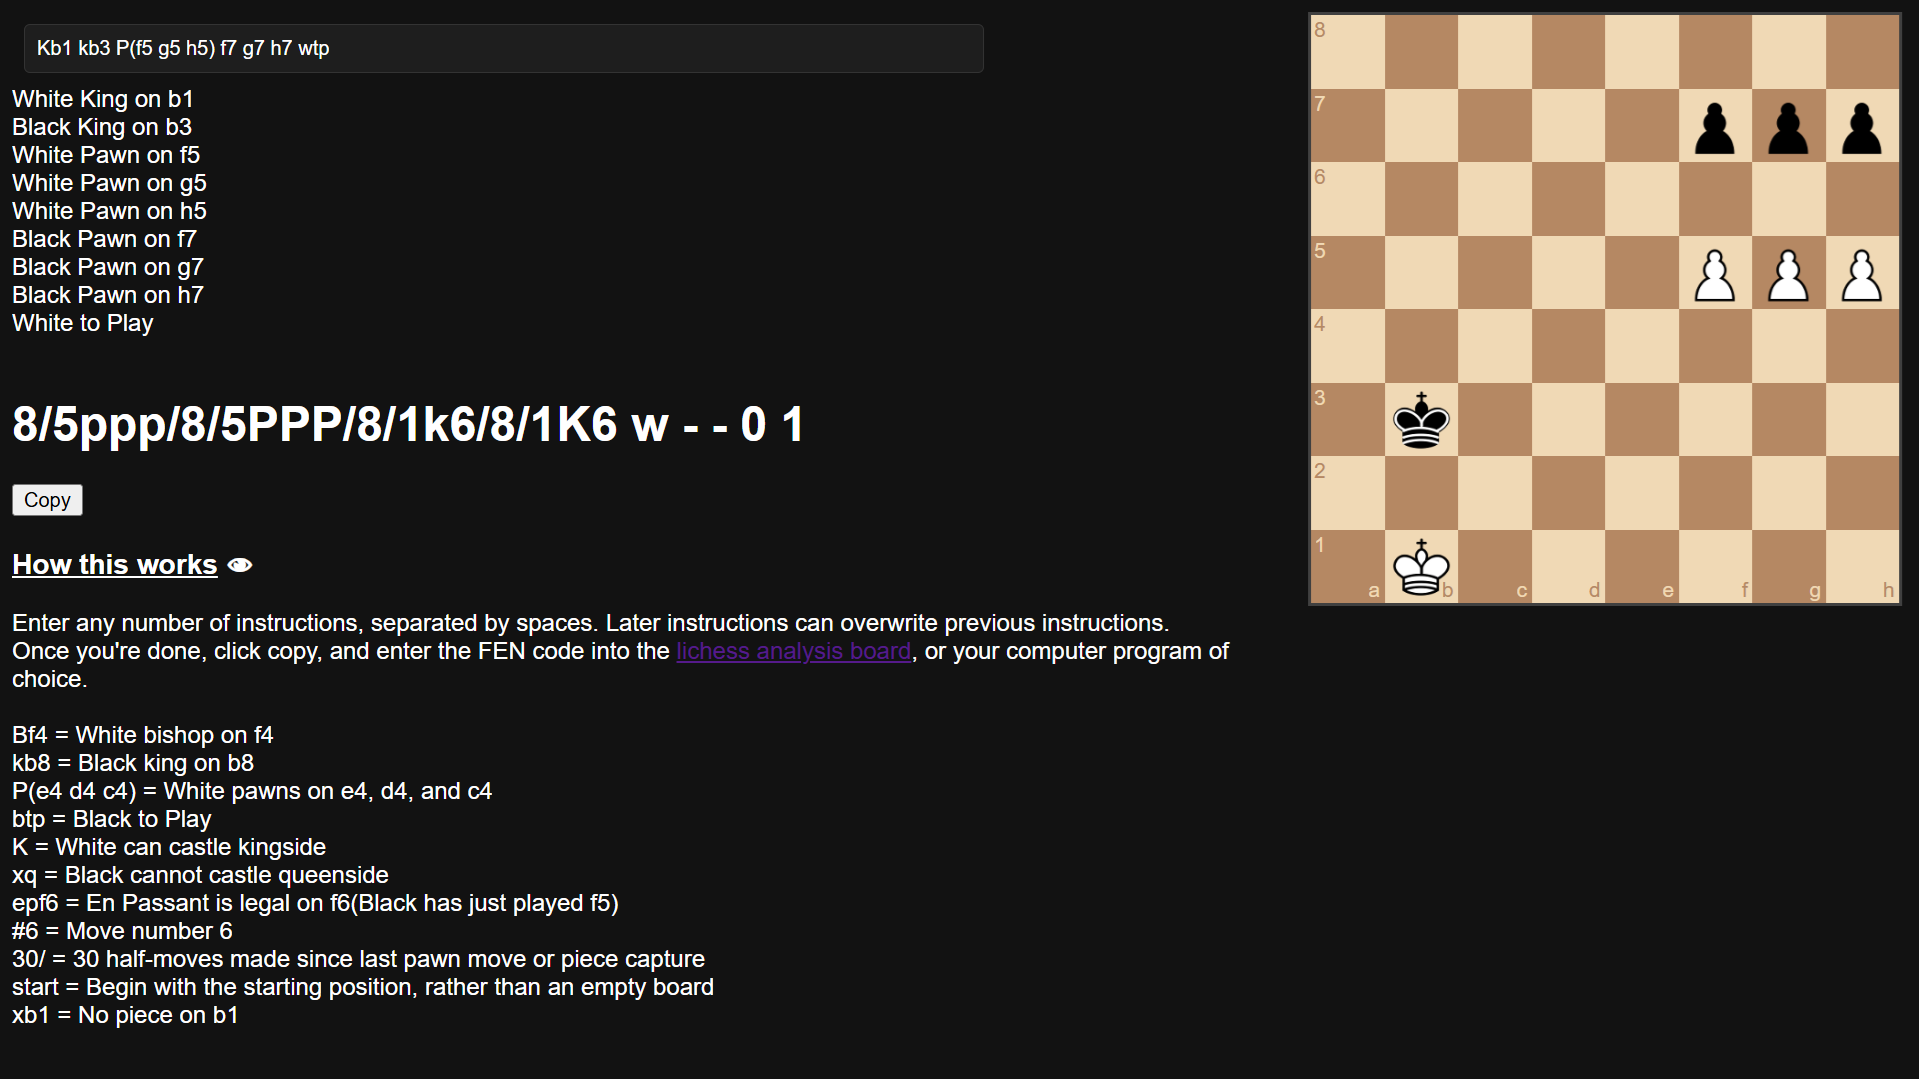
FENerator is a programmatic syntax for entering chess positions into a computer, as a quicker alternative to drag-and-drop board editors. It allows the user to enter a series of instructions, which are then parsed into a FEN code, which can be entered into any chess program.
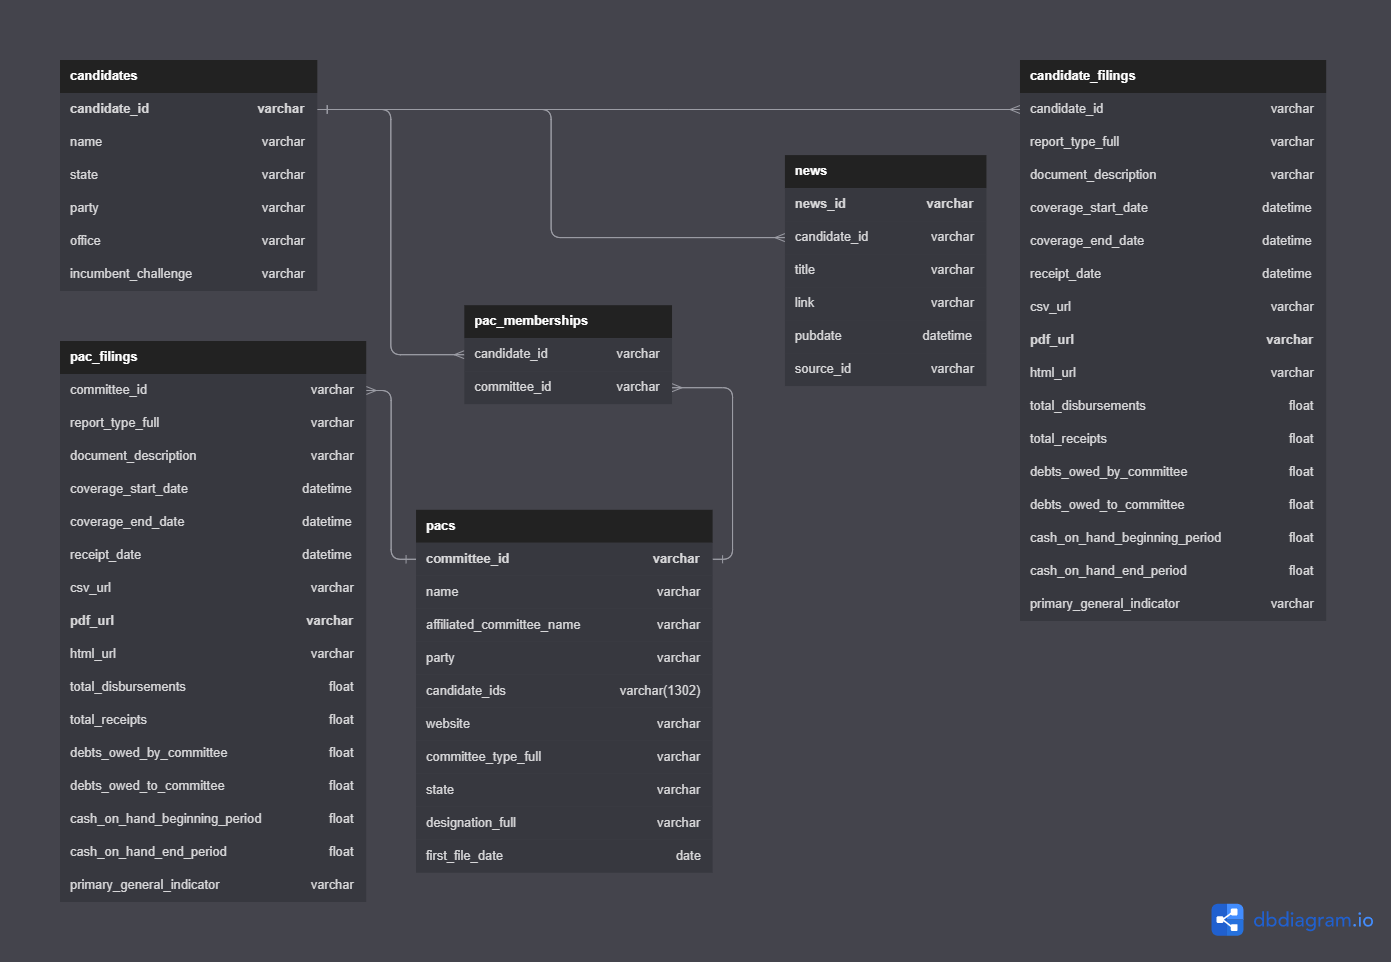
Candidate Tracking is a data warehouse which collects and processes information about candidates for US Senate, including regulatory filings, affiliations with political action committees, and mentions in news articles. The warehouse runs on AWS Redshift, and the data is collected from the OpenFEC and Newsdata.io API's, using AWS Lambda and S3.
Here is a breakdown of how many times each tracked candidate was mentioned in a popular news article, for each day since October 9th, 2022.

Stock Evaluator is a data pipeline and machine learning model which attempts to predict the long-run value of publicly traded companies. It collects financial data from companies' disparate regulatory filings(provided by the Financial Modeling Prep API), processes it into compact training examples, trains a neural network to predict the return of a share of stock over a given time period, and recommends a portfolio based on the model's predictions.
This is a work in progress. Future development will include adding features related to subjective business assessment and market conditions.
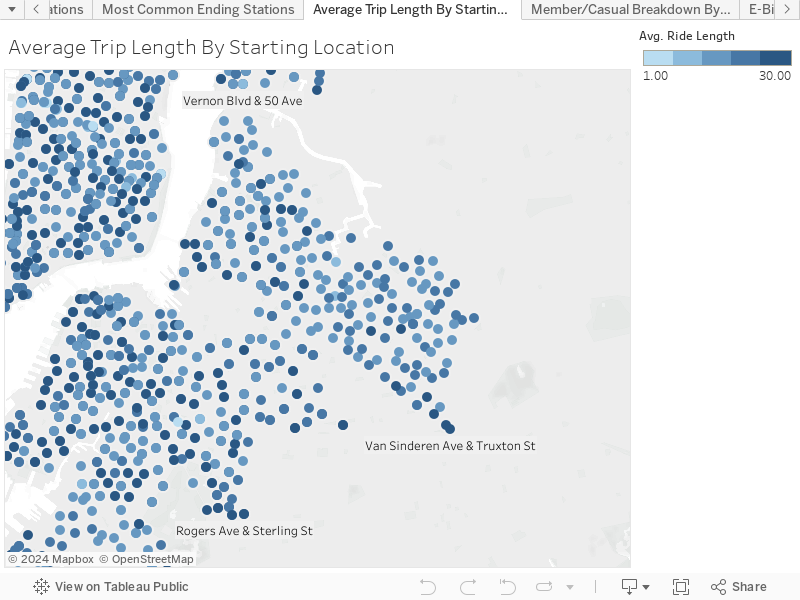
This is a series of visualizations which show usage patterns for Citi Bike, New York City's public bike share program. They were created using Tableau, and use data pulled from Citi Bike System Data.
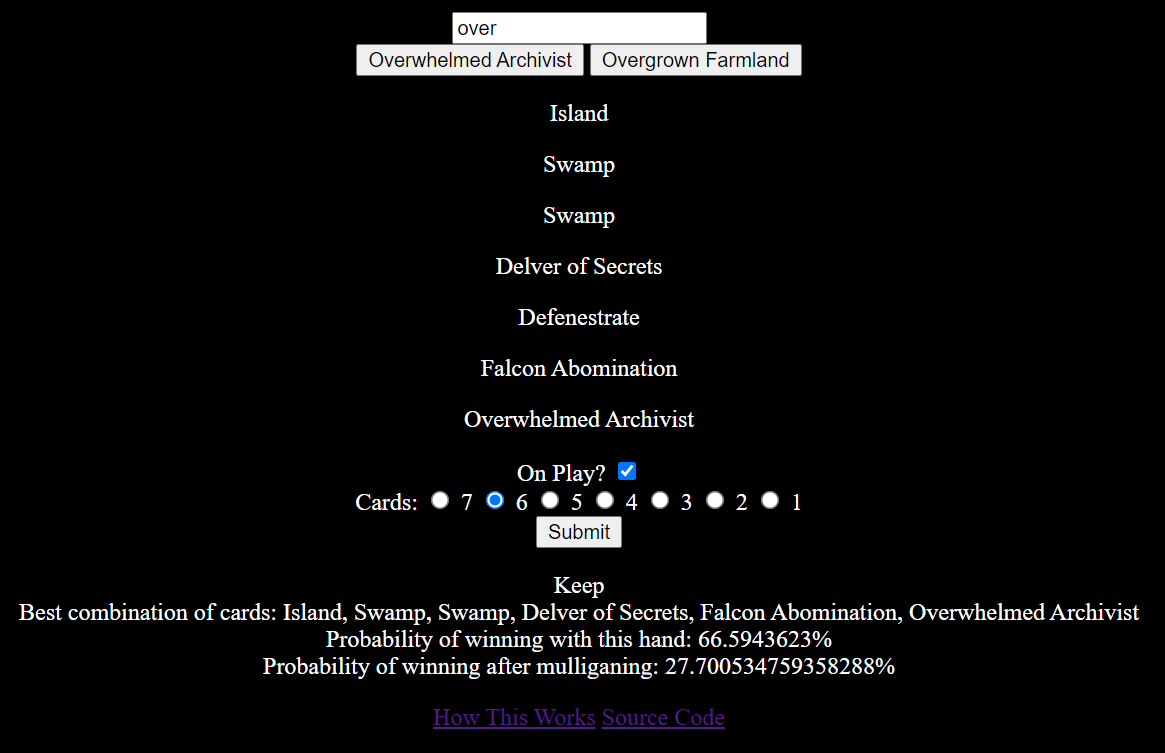
Mulligan Decider is a machine learning system for Magic: the Gathering. Using TensorFlow/Keras in Python, it analyzes thousands of recorded games from 17lands, builds a neural network to predict the probability of winning with a given opening hand, and advises the user on how to mulligan at the start of the game.
The project also includes an accompanying web application, which allows a frontend user to submit an opening hand to the model running on the backend.
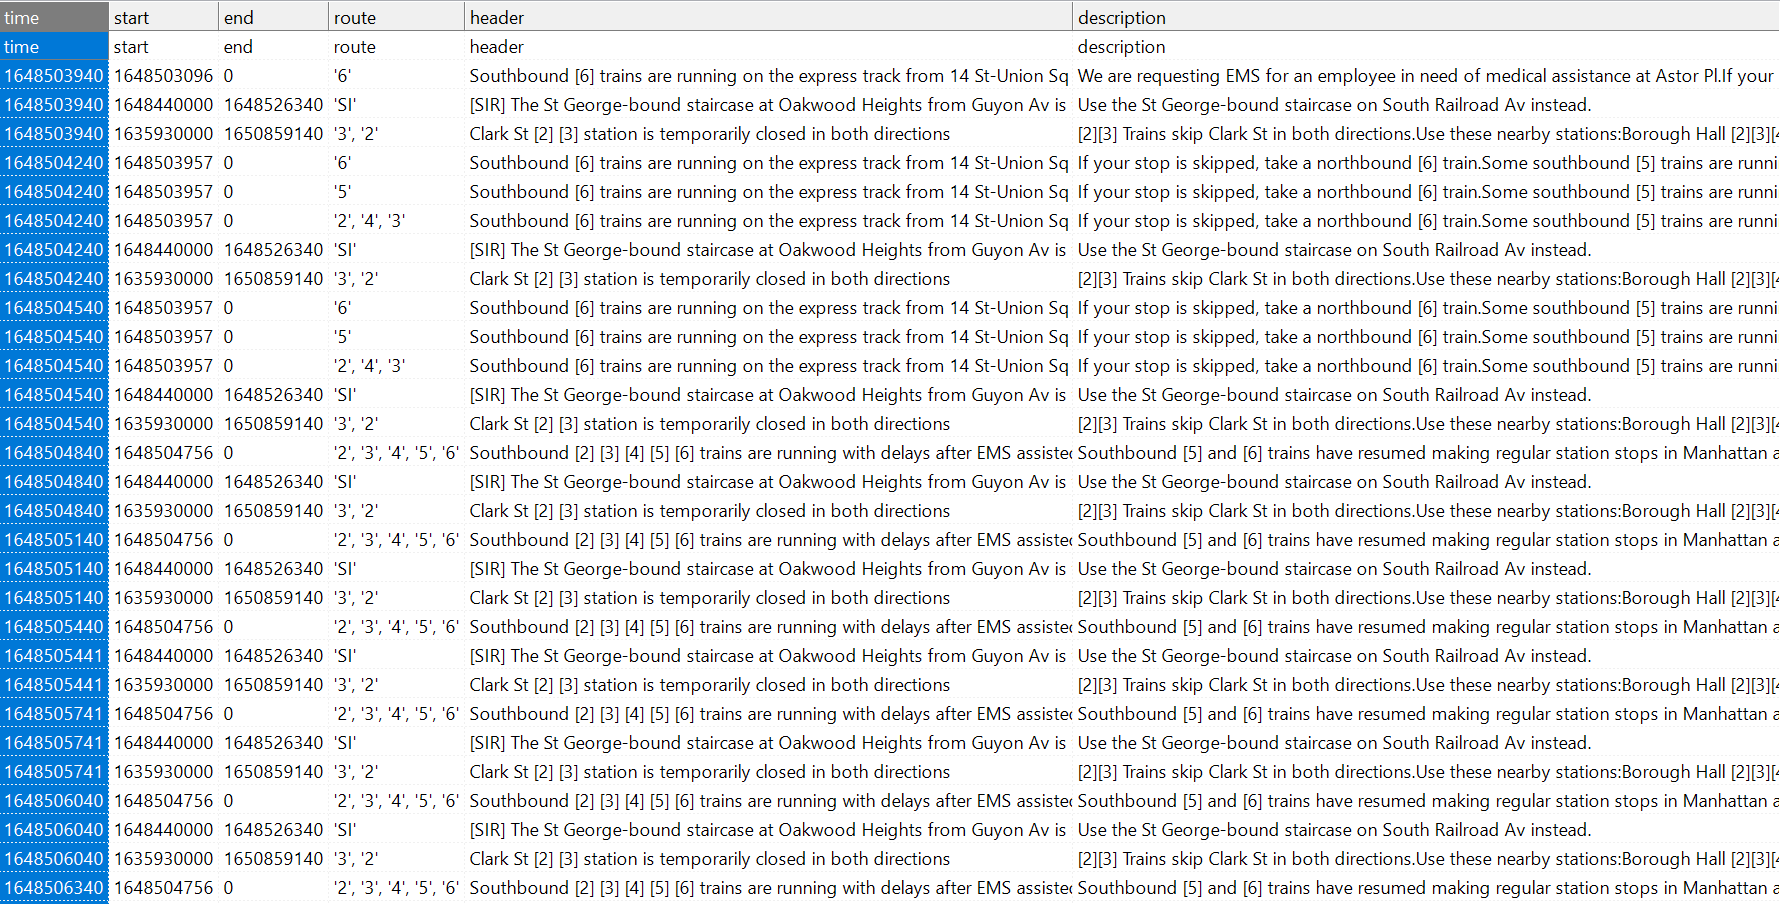

MTA Alert Archiver is an ETL pipeline which archives service alerts from the MTA's real-time API. It runs entirely on Amazon Web Services, using CloudWatch Events to run a Lambda function every five minutes, which fetches and process alerts, then inserts them into a MySQL database running on Relational Database Service.
I also created an interactive data viewer, strictly for demonstrative purposes. Click the image above to view archived service alerts from July 15th, 2022.
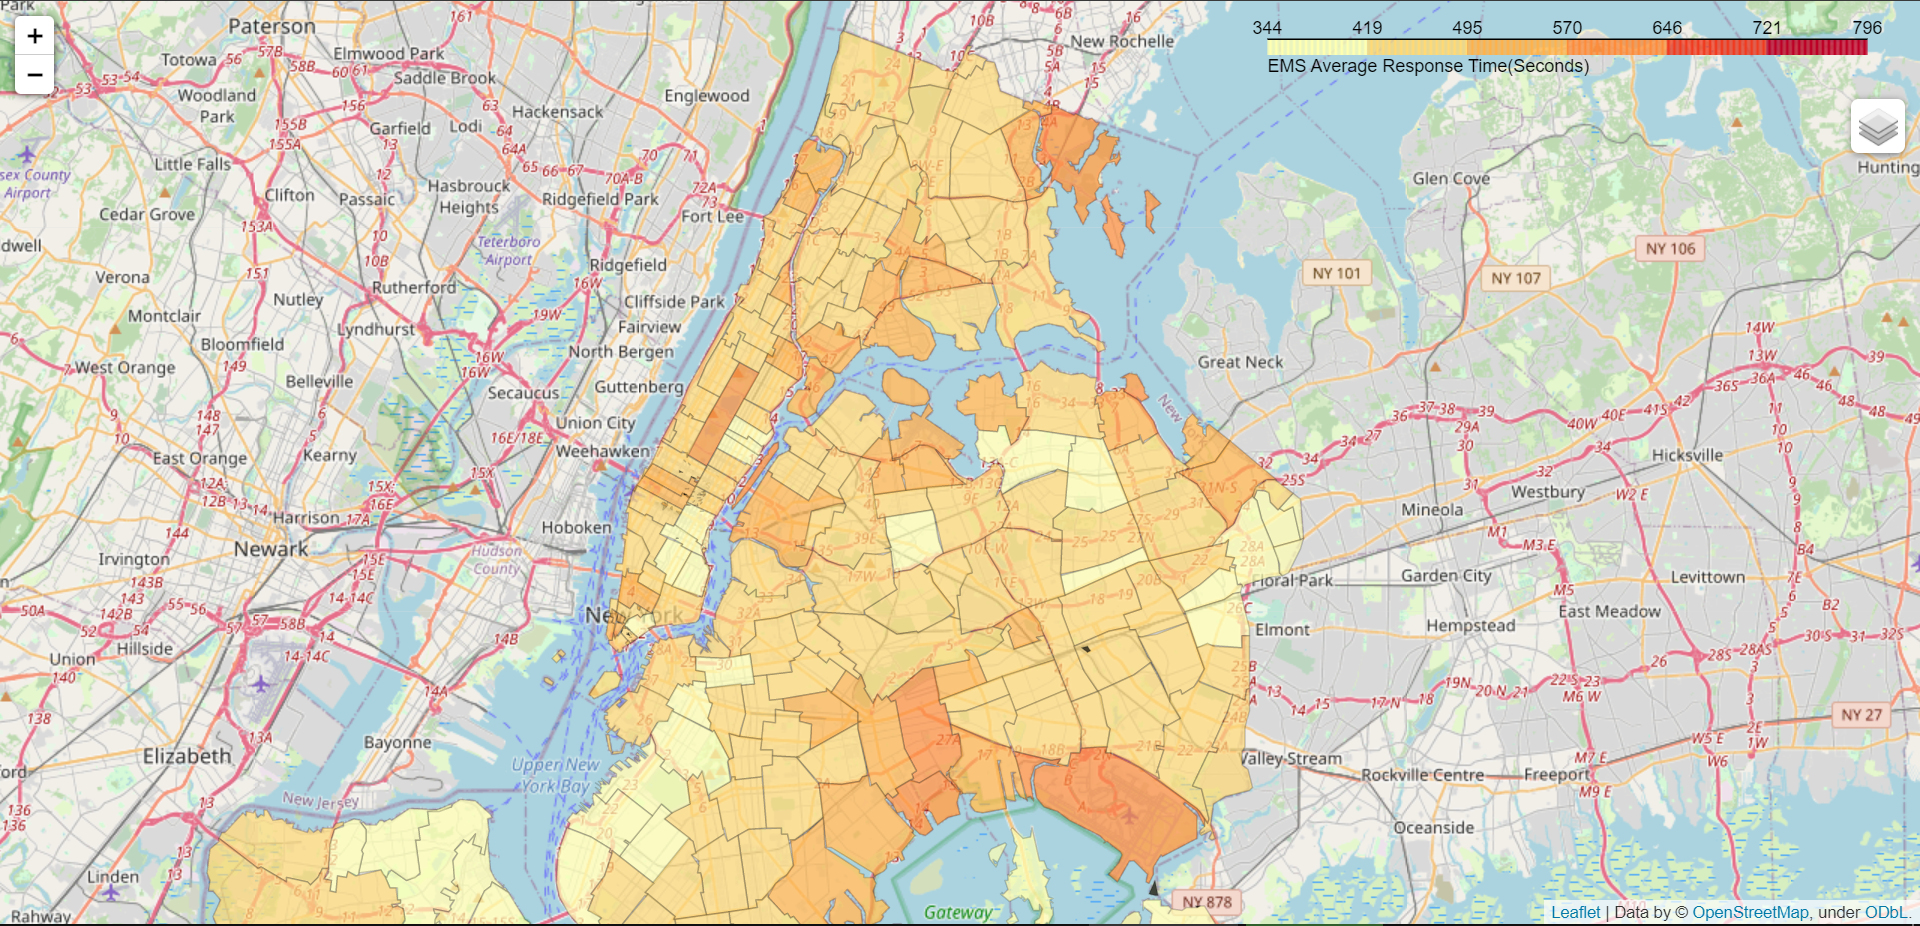
Emergency Response Times is a series of scripts which map the average response time for emergency services in each ZIP code in New York City. The data is from NYC Open Data, queried using Socrata, and the map is generated using Folium in Python.
EMS Response Times
Fire Response Times
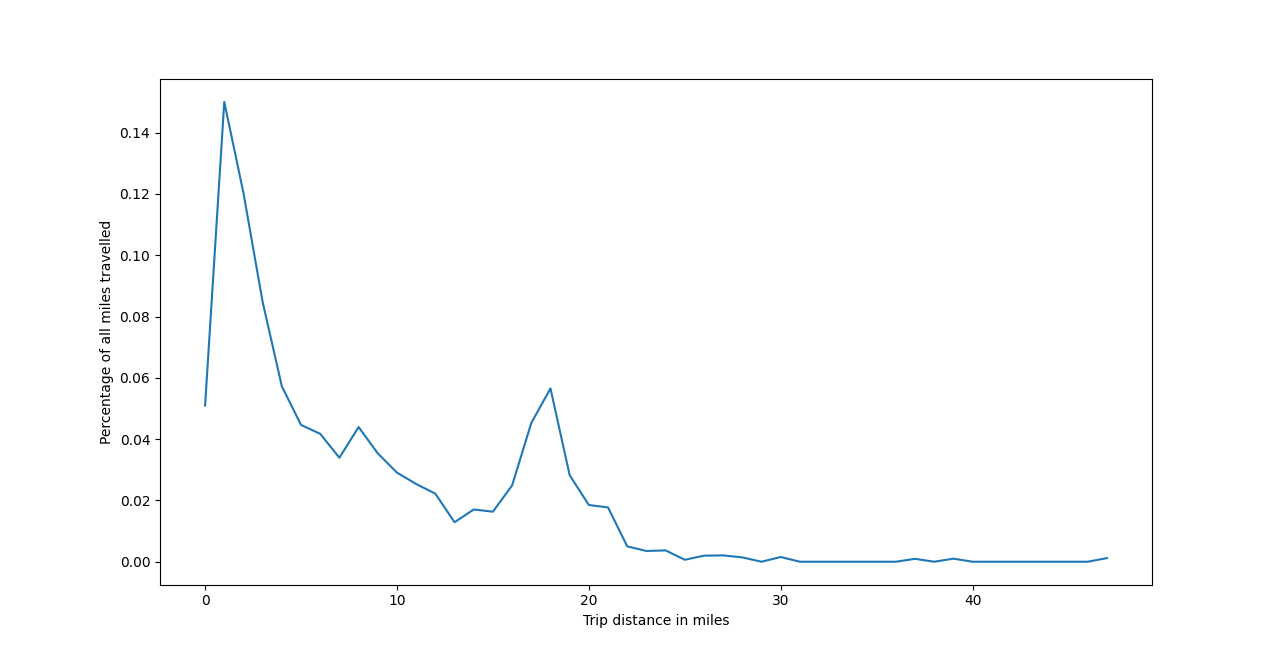
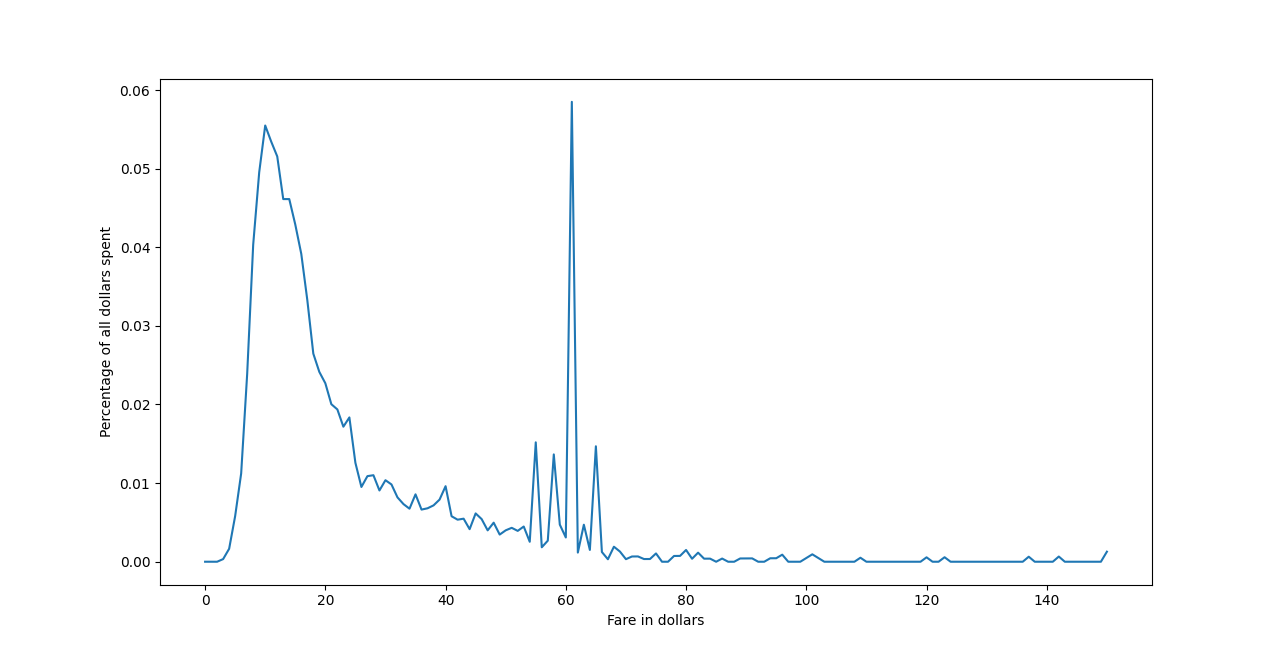
Taxi Data is a collection of scripts which analyze New York City's publicly available taxi trip data. It contains analyses of the number of trips to/from/between each neighborhood, the distribution of trip fares/distances, and the change in trip frequency over the course of the day. Graphs are generated using Matplotlib in Python.
I also joined the trip data with NWS weather data and Census demographic data, to try to create a model to predict fares at the start of the trip, but none of those features ended up being all that predictive.
I also ingested the data into Databricks using Spark to analyze it en masse. Here is a breakdown of the total number of trips, average fare, and average distance, for every day in 2021.
This very website is created and maintained by me, and serves as a live portfolio for my technical projects. All the text and images are my own, and the design is adapted from a publicly available template, Dimension by HTML5 UP, to which I've made some CSS modifications and expanded the page structure. The website is hosted through GitHub Pages, where all the source code is available, and the .ky domain is registered in the Cayman Islands.
I've also hidden some easter eggs in various places throughout the site, see if you can find them all.
I like taking pictures of city skylines, urban waterfronts, train stations, airports, and other big and important feeling places. You can find a collection of my photos on my Instagram page. There are also a couple photos hidden about this website, see if you can find them all.
The best way to reach me is by email, I try to keep my inbox on zero
This is bold and this is strong. This is italic and this is emphasized.
This is superscript text and this is subscript text.
This is underlined and this is code: for (;;) { ... }. Finally, this is a link.
Fringilla nisl. Donec accumsan interdum nisi, quis tincidunt felis sagittis eget tempus euismod. Vestibulum ante ipsum primis in faucibus vestibulum. Blandit adipiscing eu felis iaculis volutpat ac adipiscing accumsan faucibus. Vestibulum ante ipsum primis in faucibus lorem ipsum dolor sit amet nullam adipiscing eu felis.
i = 0;

while (!deck.isInOrder()) {
    print 'Iteration ' + i;
    deck.shuffle();
    i++;
}

print 'It took ' + i + ' iterations to sort the deck.';| Name | Description | Price |
|---|---|---|
| Item One | Ante turpis integer aliquet porttitor. | 29.99 |
| Item Two | Vis ac commodo adipiscing arcu aliquet. | 19.99 |
| Item Three | Morbi faucibus arcu accumsan lorem. | 29.99 |
| Item Four | Vitae integer tempus condimentum. | 19.99 |
| Item Five | Ante turpis integer aliquet porttitor. | 29.99 |
| 100.00 | ||
| Name | Description | Price |
|---|---|---|
| Item One | Ante turpis integer aliquet porttitor. | 29.99 |
| Item Two | Vis ac commodo adipiscing arcu aliquet. | 19.99 |
| Item Three | Morbi faucibus arcu accumsan lorem. | 29.99 |
| Item Four | Vitae integer tempus condimentum. | 19.99 |
| Item Five | Ante turpis integer aliquet porttitor. | 29.99 |
| 100.00 | ||